A manufacturer-independent Power Quality Monitoring system
IVPower PQM is the solution to collect and store reliably the data from any device with power quality functions, including power quality meters compatible with the IEC 61000- 4-30 Class A standard, as well as new smart meters installed at low voltage levels.
PQM provides a “network” view of the power quality: correlation between the causes of disturbances (lightning strikes…) and their consequences (voltage dips) allows fast and competent processing of customer claims and medium-term improvement of the power system.
All measurements provided by power quality meters are available and PQM indicates the operating margin.
Processing of the parameters defined in IEC 61000-4-30
IVPower PQM collects all parameters defined in the standard IEC 61000-4-30 from various quality meters, analyzes and displays them to the User. Example of information that can be immediately leveraged:
- RMS voltage (10 min), THD and asymmetry of a measurement point, on a user- um) defined interval
- Frequency (10 s) system
- Flicker, voltage and current harmonics and interharmonics
- Voltage dips and swells from all quality meters, with automatic classification according to their depth and duration
- Voltage dips and swells from oscillographic records – including half-cycle records, according to IEC 61000-4-30 for verification and access to such records from the list of the above-mentioned voltage events
- Voltage dips and swells aggregation into grid voltage events according to their timestamp and severity class
- Weekly power quality report generation according to the standard EN50160, from measurements collected by quality meters
Web Application
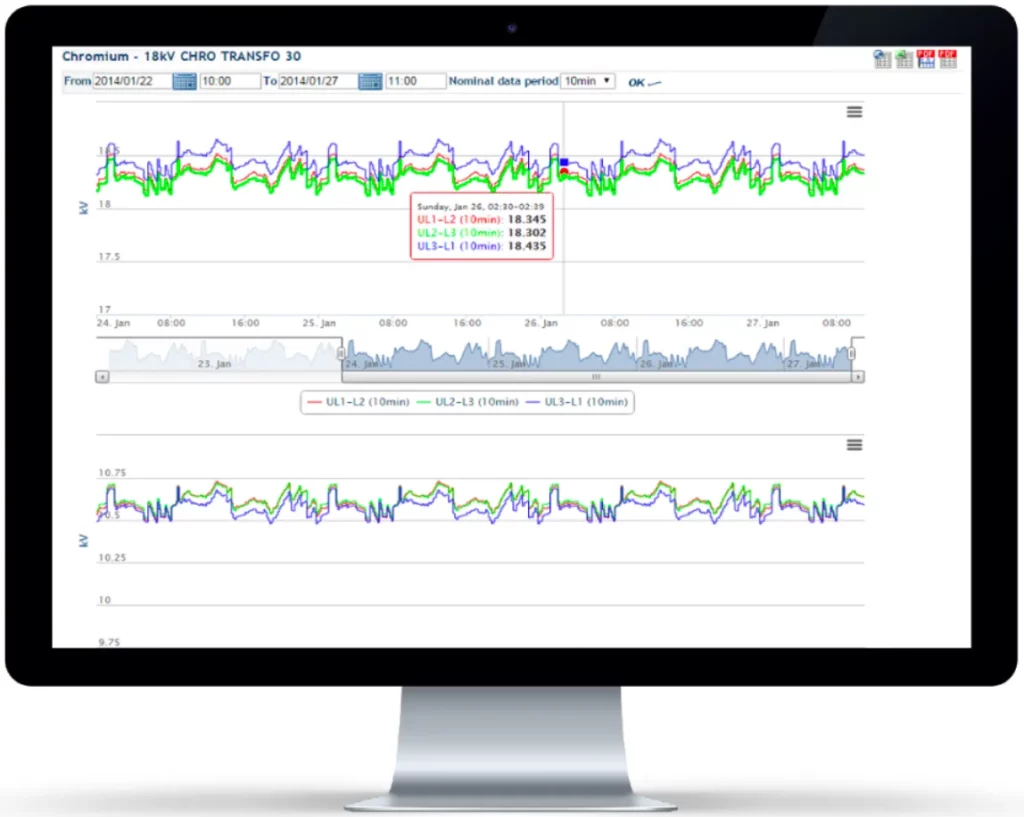
IVPower PQM’s role-based web application offers several applications to display, configure, supervise and perform system administration.
PQM allows the selection of all sort of data, with several display functionalities. For instance:
- Tooltips showing timestamps and point values of all the displayed curves.
- Vertical zooming, by stretching a rectangle with the mouse.
- Export of any curve as PNG, JPG, PDF, SVG….
- Possibility to compare measurements from 2 quality meters in the same graphic.
- Possibility to display 2 types of different measurement values in the same graphic, using 2 different scales
- Differentiate tagged measurement values
- Display customisation: colour, thickness, type, etc…
- Perfect display rendering on tablets and smartphones.
Main Software Functions
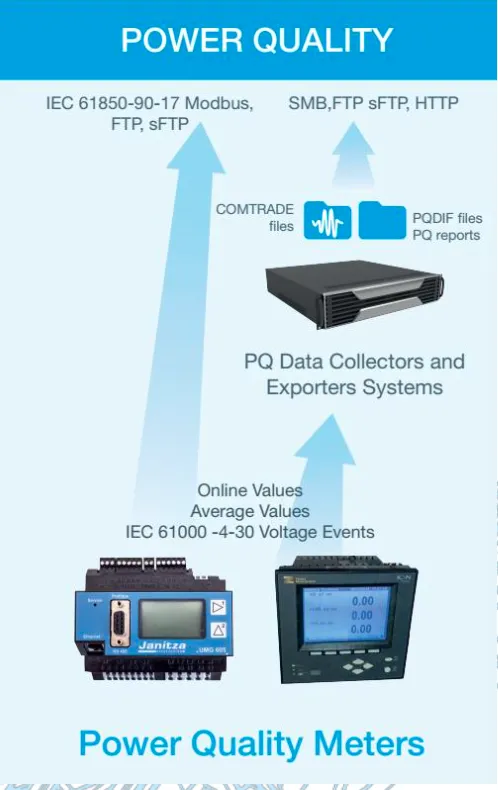
Collection of Power Quality data
PQDIF file importers:
IVPower PQM can connect directly to devices that create PQDIF files automatically, through an FTP, sFTP or IEC 61850 MMS interface.
IVPower PQM also supports the collection of PQDIF files from centralized repositories (IQ+, SICAM PQS, WinPQ …).
Devices without PQDIF interface:
IVPower PQM may also support Power Quality data collection by implementing dedicated TCP/IP interfaces to the meters.
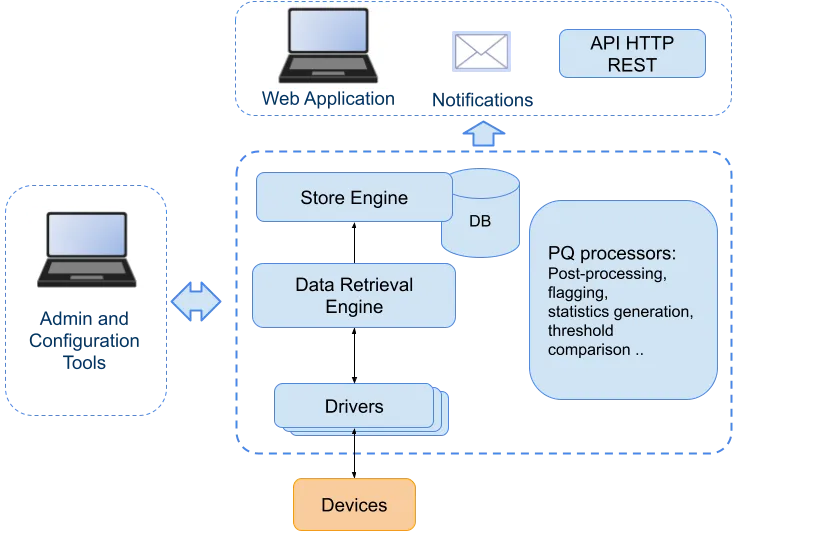
Data Retrieval Engine:
IP-oriented, IVPower PQM also supports data collection on PSTN networks by communicating directly with modems, managing priority queues and offering optimized scheduling.
Database management
PQM provides a full, reliable and high-performance storage of statistical measurement data. Installed with a dedicated PostgreSQL database, it also supports Customers’ DataBase Management Systems such as Oracle Exadata environments.
Post-processing Engine
Statistical measurements are processed at soon as they enter the system. Post-processing of the data includes:
- Voltage Event Calculations from RMS Values
- PLT Flicker Computation, in case only PST are available
- Tagging of the measurements according to IEC 61000-4-30
Over-threshold Engine
Over-threshold computation is done at the time of insertion of the measurement value in the database: it is based on the threshold values defined in the software. Hysteresis values (configurable) are used to avoid incorrect warnings.
Statistics Engine
PQM has the capability of planning the generation of statistics, mainly used today for the automatic generation of the EN50160 weekly reports.
Statistics generation can be easily planned for a given subset of measurement points. Some data filtering is performed, like the exclusion of tagged measurement values.
PQM’s Administrator GUI has a specific page for planning of report generations, with all the related tasks involved. Like a dashboard, it allows to display the next planned tasks, the past ones, if they were correctly executed etc.